

Graphing piecewise functions may seem daunting at first glance, especially when you’re working within the constraints of a calculator interface.
However, with a systematic approach, tools like the TI-84 can efficiently plot these segmented equations—an essential skill in both academic and professional STEM environments.
As a licensed electrical engineer with over 12 years of experience in residential and industrial energy systems, I’ve routinely used piecewise functions to model voltage thresholds, smart grid responses, and stepped tariff applications.
In this guide, I’ll walk you through how to use the TI-84 calculator to graph a piecewise function accurately.
We’ll also answer common questions about domain and range, continuity, and how to enter or interpret piecewise functions using different graphing calculator tools.
What Are Piecewise Functions?
Piecewise functions are defined by different expressions based on the input value (typically x).
Instead of a single formula applying across all values of x, different formulas apply depending on specific conditions. In engineering, these are frequently used to model behaviors that change abruptly, such as:
- Circuit responses to threshold voltage levels
- Energy tariffs that change based on consumption
- Load distribution in time-segmented systems
These are also known as piecewise defined functions, and being able to graph or calculate them is essential.
If you’re looking for a piecewise function calculator online, several tools like the Desmos graphing calculator or WolframAlpha can handle them easily.
However, many educational institutions and exams rely on physical tools like the TI-84 graphing calculator.
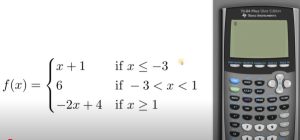
Let’s take an example function:
f(x) =
- x + 1 for x ≤ -3
- 6 for -3 < x < 1
- -2x + 4 for x ≥ 1
Why Use a TI-84 Graphing Calculator?
The TI-84 calculator is widely used in educational settings because of its robust graphing features, ease of use, and compatibility with test standards.
It also has built-in logic and test functions that allow for conditional graphing—perfect for piecewise functions.
While web-based tools like the Desmos piecewise function grapher are great for visuals, the TI-84 remains a trusted device during exams and field applications.
You can also explore apps or tools labeled as:
- Piecewise function graph calculator
- Absolute value to piecewise function calculator
- Piecewise function grapher
These tools can help you understand transformations and create expressions based on graphical inputs.
Step-by-Step: Graphing a Piecewise Function on the TI-84
1. Open the Graphing Menu
- Press the Y= button to access the function entry screen. This is where you’ll input each part of the piecewise function.
2. Input the First Expression: x + 1 for x ≤ -3
- Type: (X + 1)
- Then press the division key ÷
- Now input the condition: (X ≤ -3)
- Press 2nd → MATH to open the TEST menu
- Scroll to ≤ and press ENTER
- Complete the expression: (X+1)/(X≤-3)
3. Input the Second Expression: 6 for -3 < x < 1
- Type: 6
- Press the division key ÷
- Input the compound condition:
- Press (
- X > -3:
- 2nd → MATH → select >
- Insert logical operator and:
- 2nd → MATH → scroll right to LOGIC, select and
- X < 1:
- 2nd → MATH → select <
- Complete expression: 6/((X>-3) and (X<1))
4. Input the Third Expression: -2x + 4 for x ≥ 1
- Type: (-2X + 4)
- Press the division key ÷
- Input the condition:
- (X ≥ 1):
- 2nd → MATH → select ≥
- Complete expression: (-2X+4)/(X≥1)
- (X ≥ 1):
5. Check Your Expressions
- Use the arrow keys to scroll across and verify that all parentheses and logical conditions are entered correctly.
6. Press GRAPH
- The TI-84 will now display the piecewise function graph with clean breaks at the boundaries.
Frequently Asked Questions
How to find the domain and range of a piecewise function on a calculator?
Use the graph trace feature on your TI-84. Press 2nd → TRACE → select Value and move the cursor along the function. Note the lowest and highest x and y values to identify the domain and range.
How to write a piecewise function in a calculator?
Use division with logical conditions, just as shown above. Each condition acts like an on/off switch, turning the segment “on” only where the condition is true.
What value of k will make this piecewise function continuous calculator?
For continuity at a point (e.g., x = 1), set the expressions on either side equal at x = 1 and solve for k. This is best done manually or using symbolic algebra tools.
Can I convert absolute value to a piecewise function on a calculator?
Yes. For example, |x| becomes:
- -x if x < 0
- x if x ≥ 0 Graph each condition using the same method as above.
How to write a piecewise function from a graph using a calculator?
Analyze the graph’s line segments. For each segment, determine the slope and intercept, then find the x-values where the segment begins and ends. Construct expressions accordingly.
Troubleshooting Tips
- Use the correct negative sign (the one at the bottom right, not the minus near the + key)
- Always wrap conditions and expressions in parentheses
- For compound conditions, remember to use and, not commas
Engineering Applications of Piecewise Functions
Understanding how to graph and interpret piecewise functions is vital in various branches of electrical and energy engineering:
- Smart Grid Systems: Automatically adjust energy flow based on time-of-day pricing using conditional logic
- Load Balancing: Manage residential and industrial electrical demand during peak/off-peak hours
- LEED-Certified Projects: Model sustainability scores or carbon offset criteria that change across consumption bands
- Embedded Systems: Code microcontrollers to behave differently based on sensor thresholds
Many of these scenarios can be modeled first using a piecewise function calculator and then simulated on software or calculated with a physical graphing calculator like the TI-84.
Other Tools to Explore
While the TI-84 remains a top choice, don’t overlook:
- Desmos graphing calculator for interactive visualizations
- GeoGebra for symbolic manipulation and graph overlays
- CASIO fx-series graphing tools
- Online tools labeled ‘piecewise defined function calculator’ or ‘piecewise function graphing calculator’
These platforms also answer common queries like:
- How to write a piecewise function from a graph
- How to make the function continuous at a point
- How to trace domain and range quickly
Mastering the skill of graphing piecewise functions on the TI-84 calculator opens the door to accurately modeling real-world systems—from control circuits to tariff structures.
Whether you are studying for exams, building a model for an energy audit, or programming automation logic, understanding how to enter, test, and graph these functions is essential.
For those still learning, try comparing the output from your TI-84 with an online piecewise function graph calculator to confirm accuracy.
As you become more fluent, you’ll be able to mentally construct these models before even touching a button.
All Image Credit: The Math Sorcerer